Rendering SVG Country Maps in Python
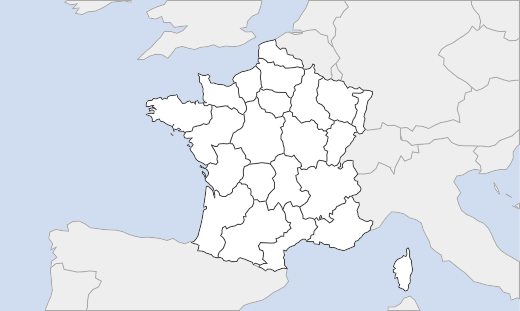
In this post I will explain the rendering process of the Piwik country maps. The results will basically look like this:
Getting the viewport
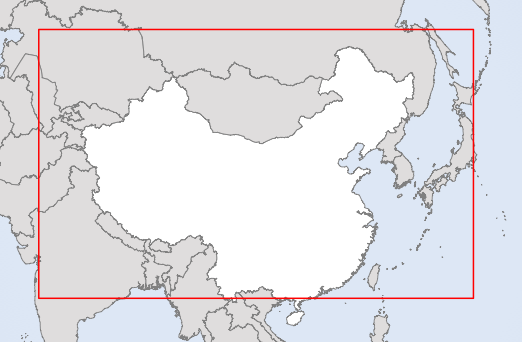
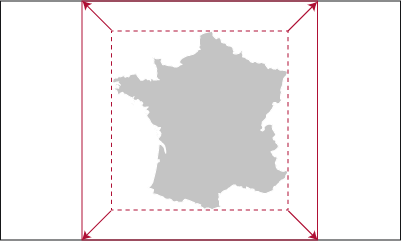
The first step of drawing a map is to define the viewport, which is a rectangle containing the geometry that will be visible in each map. To simplify things a lot, we decided to use a fixed aspect ratio for the maps. What we need next is a way to get the outer bounding box of the countries. The simple approach is to use the lat/lon bounding box, but this actually doesn’t work for the orthographic projection, as the minimum latitude of a country doesn’t necessarily correspond with the minimum y of the projected country. For instance, the following image shows the lat/lon bounding box of China:
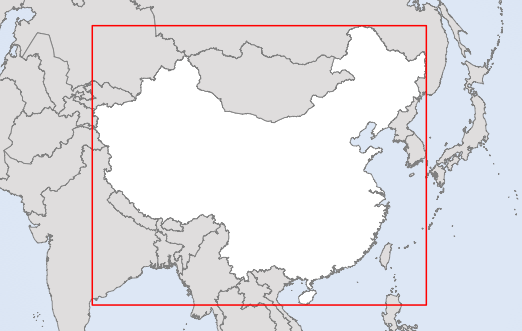
Instead, you need to project the polygons first, and then compute the bounding box in x/y space. As explained in the last post, I will use the orthographic projection. To avoid distortions and ensure that the country is fully visible, the projection must be centered on the target country. For the computation of the center latitude and longitude I used the Polygon package (a Python wrapper around the GPC library) which provides a function for computation of center of gravity (also called centroids). Code. Now we can project the country polygons and compute the exact bounding box, which then can be used to scale and position the map inside the viewport. Here’s the bounding box of China, again:
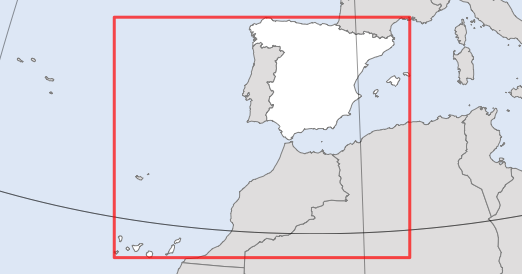
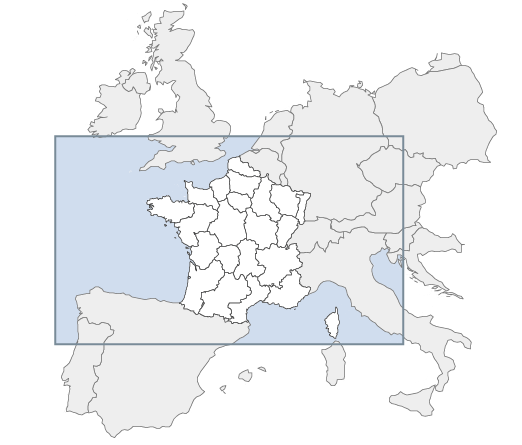
However, while this approach works for most countries, other countries are a bit trickier to handle. As you can see in the next image, Spain has one big polygon commonly known as Spain along with several little polygons (islands) which located far away of the main country. This leads to a much bigger bounding box that we want, since in our scenario, we want the maps to be focused on the major part of each country. We have to find a better way to compute the bounding box.
My first thought was to only consider the largest polygon when computing the bounding box. The shape area computation is done by a nice algorithm I found here and was ported to Python there. Again, this works in many cases (like Spain, USA), but it won’t work in other cases, like New Zealand:
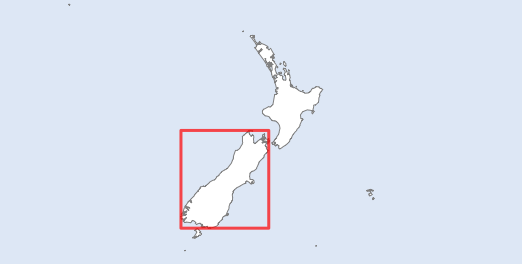
My final solution was to compare each country polygon area with the maximum polygon area of that country. Every polygon below a fixed threshold (for instance 10% of the maximum polygon area) is discarded, which seem to work out very well. For five countries (including Japan), I had to manually change the threshold to get a nicer bounding box, which was faster and easier than spending more time in algorithm improvements.
Projection
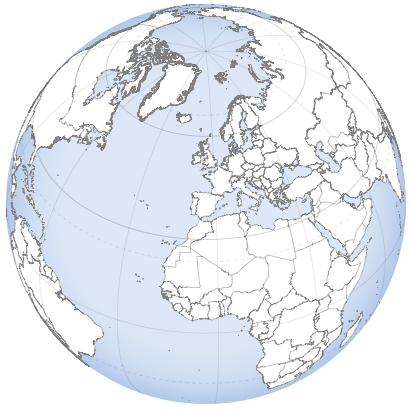
Now we can proceed with the actual projection of all visible countries. For the orthographic projection, I initially wanted to use the pyproj package, a wrapper around the de facto ‘gold standard’ PROJ.4. Unfortunately, the design of the map requires that the client-side also needs to be able to perform projections. Therefore, I would have to port parts of the PROJ.4 code to JavaScript, which is something I’ve done before in ActionScript and actually don’t want to do again. Instead, I found a nice and simple Python implementation of the orthographic projection by Niall McCarroll, which was very easy to port to JavaScript. Using this class it was very easy to render such a beautiful globe in SVG:
The bounding boxes computed in the last step are now used to detect all countries that (probably) intersect our viewport. This is important to know because we need to reduce the data to keep the rendering time low. To give the country a little more context, the bounding boxes are inflated by 30% and then centered inside the viewport. Now every countrys bounding box is checked for intersections with the viewport.
The basic idea now is to render the inner-country administrative boundaries for the focus country and the national boundaries for the neighbor countries. At the end of this step, we end up with a map like this.
Polygon simplification and clipping
What you can’t see in the above screenshot is that the resulting SVG file has a size of 578kB, which is way to much given the fact that we need to store more than 200 maps. I actually agreed with the Piwik core developers that the zipped final size of the SVG maps should not 1 megabyte. So, what we need to do is to simplify or generalize the polygons. There are several algorithms for polygon simplification, like the ones by Douglas & Peuker and Visvalingam, but I used a very fast and simple one. Actually, it’s the same algorithm that I used a few years ago, when I rendered my first world maps in Flash.

Since we don’t need the surrounding countries in the same quality as the focus country, I used different qualities for the simplification, which is great for reducing the map size. After simplification, the file size has reduced to 21kB or 3%. The next task was to throw away everything that lays outside of the viewport. It’s important to do this after simplification since otherwise the simplification could destroy the viewport borders. To clip the polygons to the viewport I used the Python Polygon package again, which allows for syntactic sugar like this:
clippedPoly = polygon & viewportConclusion
After clipping, I rendered the polygons as SVG file to get the final map. The final zip-file with all 238 country maps is 840kB.
In the next post I will write about how to connect the region ids of the Natural Earth shapefile with the region ids of the GeoIP database.
Update (Nov. 3)
Instead of the Orthographic projection, the maps now are projected using the Lambert Azimuthal Equal Area projection, which is widely used in cartography. For most countries, the differences are invisible, but the surrounding of larger countries like Russia look much less distorted.
Comments
matthieu (Oct 26, 2011)
Beautiful work & explanations! :)
bkor (Aug 02, 2012)
The map of The Netherlands is too simplified. The result is just wrong.