Tutorial: Rendering a World Map in ActionScript
This tutorial is the third part of a tutorial series about customized map projection in flash/actionscript. It demonstrates how to draw a world map using the as3-proj library and some helper classes. I assume that we read in a shapefile using the SHP library as shown in the previous tutorial. [1 Reading Shapefiles in PHP](http://vis4.net/blog/2010/04/reading-esri-shapefiles-in-php), [2 Reading Shapefiles in ActionScript](http://vis4.net/blog/2010/04/reading-shapefiles-in-as3/), 3 Displaying a Static World Map in ActionScript.
This tutorial assumes that we read in a shapefile using the SHP library as shown in the previous tutorial. At first I present you a very quick and dirty way of rendering a map, which means that I tried to reduce dependencies to other classes or libraries and put almost all code in one function. On the next page you’ll see a solution that are more (re-)usable.
The Quick and Dirty Way
After we read in the shapefiles, we’re now going to project the coordinates. Therefore we must chose and initialize a map projection. I’m using the Wagner V projection of the as3-proj library.
var projection: Projection = new Wagner5Projection();
projection.initialize();
The next thing we need to do is to calculate the range of the projected coordinates in order to map them to our desired map size. Since we don’t know the output range of the projection formulas we initialize the variables for the minimum and maximum values with infinite numbers.
var min_x: Number = Number.POSITIVE_INFINITY,
	max_x: Number = Number.NEGATIVE_INFINITY,
	min_y: Number = Number.POSITIVE_INFINITY,
	max_y: Number = Number.NEGATIVE_INFINITY;
Now we iterate over all coordinates, project them with the Projection.project() method and update the min/max values.
for each (var record:ShpRecord in records) {
    if (record.shapeType == ShpType.SHAPE_POLYGON) {
        var poly:ShpPolygon = record.shape as ShpPolygon;
        for each (var coords:Array in poly.rings) {
            for each (var pt:ShpPoint in coords) {
                var o:Point;
                o = projection.project(deg2rad(pt.x), deg2rad(pt.y), new Point());
                min_x = Math.min(min_x, o.x);
                max_x = Math.max(max_x, o.x);
                min_y = Math.min(min_y, o.y);
                max_y = Math.max(max_y, o.y);
            }
        }
    }
}
Once we have the min/max values for x and y we can proceed with the map drawing. We need to scale and translate the projected coordinates to place them inside our desired map. The scale is calculated beforehand. The drawing is done using the moveTo() and lineTo() methods of the flash drawing api.
var w:Number = stage.stageWidth, h:Number = stage.stageHeight;
var s:Number = Math.min(w / (max_x - min_x), h / (max_y - min_y)); // the scale

for each (record in records) {
    if (record.shapeType == ShpType.SHAPE_POLYGON) {
        poly = record.shape as ShpPolygon;
        for each (coords in poly.rings) {
            graphics.lineStyle(0, 1);
            for each (pt in coords) {
                o = projection.project(deg2rad(pt.x), deg2rad(pt.y), new Point());
                o.x = (o.x - min_x) * s + (w-(max_x-min_x)*s)/2;
                o.y = h - (o.y - min_y) * s - (h-(max_y-min_y)*s)/2;
                if (pt == coords[0]) graphics.moveTo(o.x, o.y);
                else graphics.lineTo(o.x, o.y);
            }
            graphics.lineStyle();
        }
    }
}
The result is a nicely centered world map (click image to see the swf): 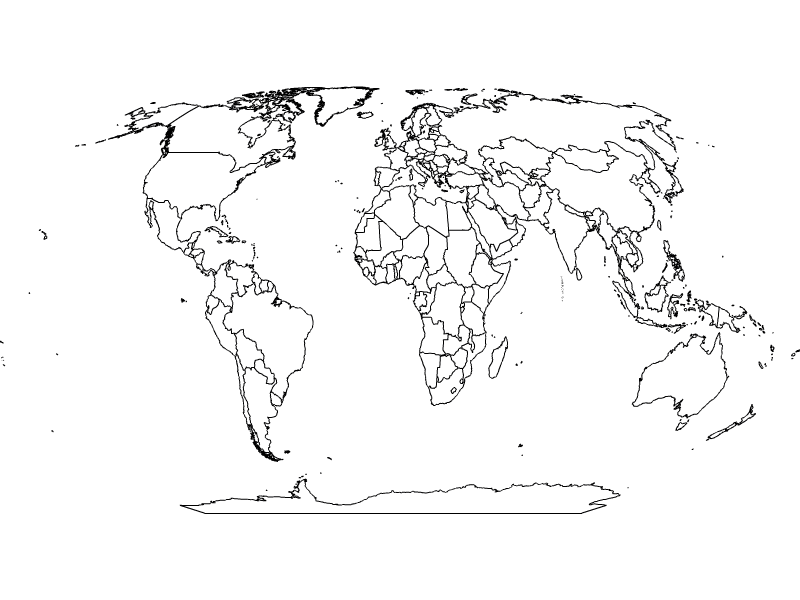 The quick and dirty way has a few drawbacks and a lot of potential for improvements.
Avoiding duplicate projection calculations
Instead of calculating the projection twice for each point it would be better to store the points after the first projection. We could do this using normal arrays but I suggest the usage of my helper classes Polygon and PointSet. We can also replace the calculations of minimum and maximum coordinates using the boundingBox property of the polygons together with the Rectangle.union() method.
var record:ShpRecord, poly:ShpPolygon, coords:Array, pt:ShpPoint;
var polygons:Array = [];
var bounds:Rectangle = new Rectangle();

for each (record in records) {
    if (record.shapeType == ShpType.SHAPE_POLYGON) {
        poly = record.shape as ShpPolygon;
        for each (coords in poly.rings) {
            var out:PointSet = new PointSet;
            for each (pt in coords) {
                out.push(projection.project(deg2rad(pt.x), deg2rad(pt.y), new Point()));
            }
            var out_poly:Polygon = new Polygon(out);
            // store polygon and update the bounding box
            polygons.push(out_poly);
            bounds = bounds.union(out_poly.boundingBox);
        }
    }
}
SolidPolygonRenderer and DataView
Because the rendering of polygons and the following view calculations must be done for every map projection I thought it would be a good idea to put this functionality into separate classes. That makes our code shorter and also more readable. The polygon rendering is done by the OutlinePolygonRenderer class, which implements the IPolygonRenderer interface to enable easy exchanges of renderer classes without having to change the rest of the code. The scaling and translation of the projected points is done by the DataView class, which works nicely together with the PolygonRenderer. After all, the rendering code has shrinked to the following few lines:
var renderer:IPolygonRenderer = new OutlinePolygonRenderer(0x000000, 1);
var screen:Rectangle = new Rectangle(0,0, stage.stageWidth, stage.stageHeight);
var view:DataView = new DataView(bounds, screen);

for each (out_poly in polygons) renderer.render(out_poly, graphics, view);
Taking care of the projection limitations
Some projections are limited to a specific latitude or longitude range (e.g. the mercator projection, which is not able to display latitudes of 90° because this would lead to infinite y values). This means we have to check each coordinate before we project it. To simplify this check I added the method Projection.testPointDeg() to the Projection api. In the end, the complete rendering looks like this:
// see the previous tutorial
var records:Array = ShpTools.readRecords(shp);

// step1: preprocessing and polygon creation
var projection:Projection = new Wagner5Projection();
projection.initialize();

var polygons:Array = [];
var bounds:Rectangle = new Rectangle();

for each (var record:ShpRecord in records) {
    if (record.shapeType == ShpType.SHAPE_POLYGON) {
        var poly:ShpPolygon = record.shape as ShpPolygon;
        for each (var coords:Array in poly.rings) {
            var out:PointSet = new PointSet;
            for each (var pt:ShpPoint in coords) {
                if (projection.testPointDeg(pt.y, pt.x)) {
                    var o:Point;
                    o = projection.project(deg2rad(pt.x), deg2rad(pt.y), new Point());
                    o.y *= -1;
                    out.push(o);
                }
            }
            var out_poly:Polygon = new Polygon(out);
            // store polygon for later rendering
            polygons.push(out_poly);
            // update bounding box
            bounds = bounds.union(out_poly.boundingBox);
        }
    }
}

// step2: polygon rendering
var renderer:IPolygonRenderer = new OutlinePolygonRenderer(0x000000, 1);
var screen:Rectangle = new Rectangle(0,0, stage.stageWidth, stage.stageHeight);
var view:DataView = new DataView(bounds, screen);

for each (out_poly in polygons) renderer.render(out_poly, graphics, view);
Rendering of Sea and Graticule
A great way to improve the visual understanding of a map projection is to integrate the sea boundary and a graticule. If you’re interested in how to draw them in detail, please take a look at the source files. 
As usual you can download a zip file containing all files related to this tutorial. Additionally I uploaded and linked api docs for the classes I used in this tutorial.
Hope this tutorial was useful to you, sorry for any grammar and spelling errors. If you like you can donate an amount of your choice via paypal. Thanks! ![]()
Comments
Gregor (Apr 27, 2010)
Sounds like a good idea, but this doesn’t work because transform() expects a flash.geom.Point and not a org.vanrijkom.shp.ShpPoint. So instead it would be
o = projection.transform(new Point(pt.x, pt.y), new Point());
which is much nicer than using project() because we get results in metres.
Thanks for this remark.
vtstarin (Apr 27, 2010)
Thank you for making this tutorial.
Instead of using > o = projection.project(deg2rad(pt.x), deg2rad(pt.y), new Point());
Can we use this method > o = projection.transform(pt, new Point()); in Projection class.
vtstarin (Apr 30, 2010)
Hi Gregor,
No need to calculate the range of the projected coordinates again in coding, because shapefile already has [shp_bounding_box] value stored in for us.
Gregor (Apr 30, 2010)
That might work sometimes but it doesn’t work in all cases and especially not for all projections. Take a look at some of the azimuthal projections and what kind of distortion they’re introducing. Here is a small example to prove this:
Let’s say you want to project the following coordinates (-180°;-70°), (0°;0°) and (180°;70°) using the Mollweide projection. The projection of the data bounding box would be much larger than the bounding box of the projected coordinates, because at Mollweide the projected longitude distance are getting smaller, the nearer you get to the poles.
Nathan (Jun 02, 2010)
Hi Gregor. First, thanks for the helpful projection classes and their accompanying tutorials. Great stuff.
I have a question about the DataView class and the polygon rendering routine, particularly this line:
var screen:Rectangle = new Rectangle(0,0, stage.stageWidth, stage.stageHeight);
When I change the first two coordinates of the screen object to anything besides (0,0), the map no longer draws on screen. Tracing through the code and the DataView class, it appears that the scale (which is incredibly large for my data set) is creating massive x- and y-offsets, so the map is drawn with coordinates in the tens or hundreds of thousands.
Essentially, I want to be able to move the initial starting coordinates of the screen rectangle so my map will draw anywhere on the screen (and at any scale) that I choose. Any suggestions? Was the DataView class only designed with stage-sized boundaries in mind, or am I missing something simple here?
Thanks again.
Gregor (Jun 02, 2010)
Hi Nathan
I think there might be some bugs in the DataView class.. While doing the map rendering speed comparision I also found out that the map rendering I showed in this tutorial still needs a lot of performance improvements.
So what I recommend to you now is to take a look at a more simple example of map rendering in actionscript. I also uploaded the source file, which contains all calculation needed to render the map. If you want to run this locally, you need to download the used csv map data file as well.
Good luck.
Nathan (Jun 03, 2010)
Thanks, Gregor. At least I know I’m not insane trying to get it to work.
One other possibility: could I drop the projection on a sprite, rather than on the stage? The render() method passes a Graphics class as its second argument and I tried creating a Sprite called _canvas, then passing _canvas.graphics to the PolygonRenderer, but it didn’t work.
Perhaps I’m not understanding the render() method properly.
Gregor (Jun 03, 2010)
What you’re trying to do should be no problem, the render() method definitly draws on the given canvas. Maybe you forgot to add your sprite to the stage?
Again, please try the more simple example I posted in my previous comment. You find all the code you need (100 lines or so) without dependency to any of my other projection classes. This might help you, at least until I find the time to do some bug-fixing and performance optimization on the net.vis4.renderer package.
Rendering SVG Country Maps in Python — vis4.net (Nov 03, 2011)
[…] There are several algorithms for polygon simplification, like the ones by Douglas & Peuker and Visvalingam, but I used a very fast and simple one. Actually, it’s the same algorithm that I used a few years ago, when I rendered my first world maps in Flash. […]