Re-coloring Illustrator graphics based on JSON data files
When working on choropleth maps or charts in Illustrator, sometimes the (final) data is not yet available by the time you’re designing the graphic. The typical work-around is to re-import the updated part of the graphic and align it with the rest of the artwork. But this is tedious work, especially if you’re dealing with multiple maps. To address this problem I wrote an Illustrator script that can re-color the artwork based on a JSON file. This blog post will walk you through how to use the script.
Step 1: Installing the colorizer script
To install the script you will need to clone our ai-scripts repository inside your Illustrator script folder. If you’re on macOS or OSX this would look something like this:
❯ cd /Applications/Adobe\ Illustrator\ CC\ 2017 ❯ cd Presets.localized/en_US/Scripts ❯ git clone [email protected]:newsdev/ai-scripts.git
Depending on what Illustrator version you’re using you might need to adjust the path in the first line. Alternative to cloning the repo, you can also just download the ai-scripts ZIP archive and unpack it into the Illustrator Scripts folder.  After restarting Illustrator you should see the new scripts in the File > Scripts menu:
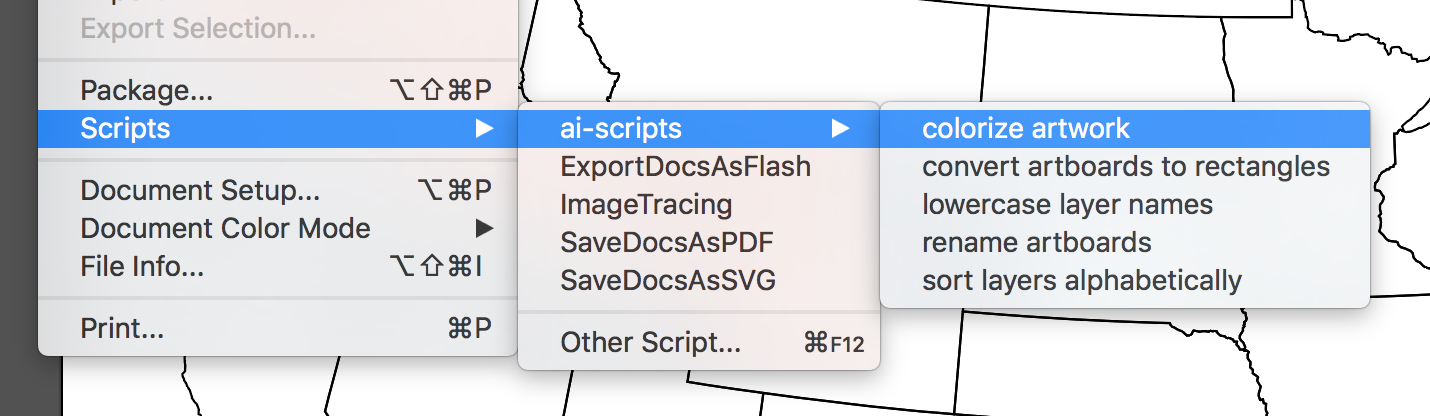
Step 2: Setting up the Illustrator document
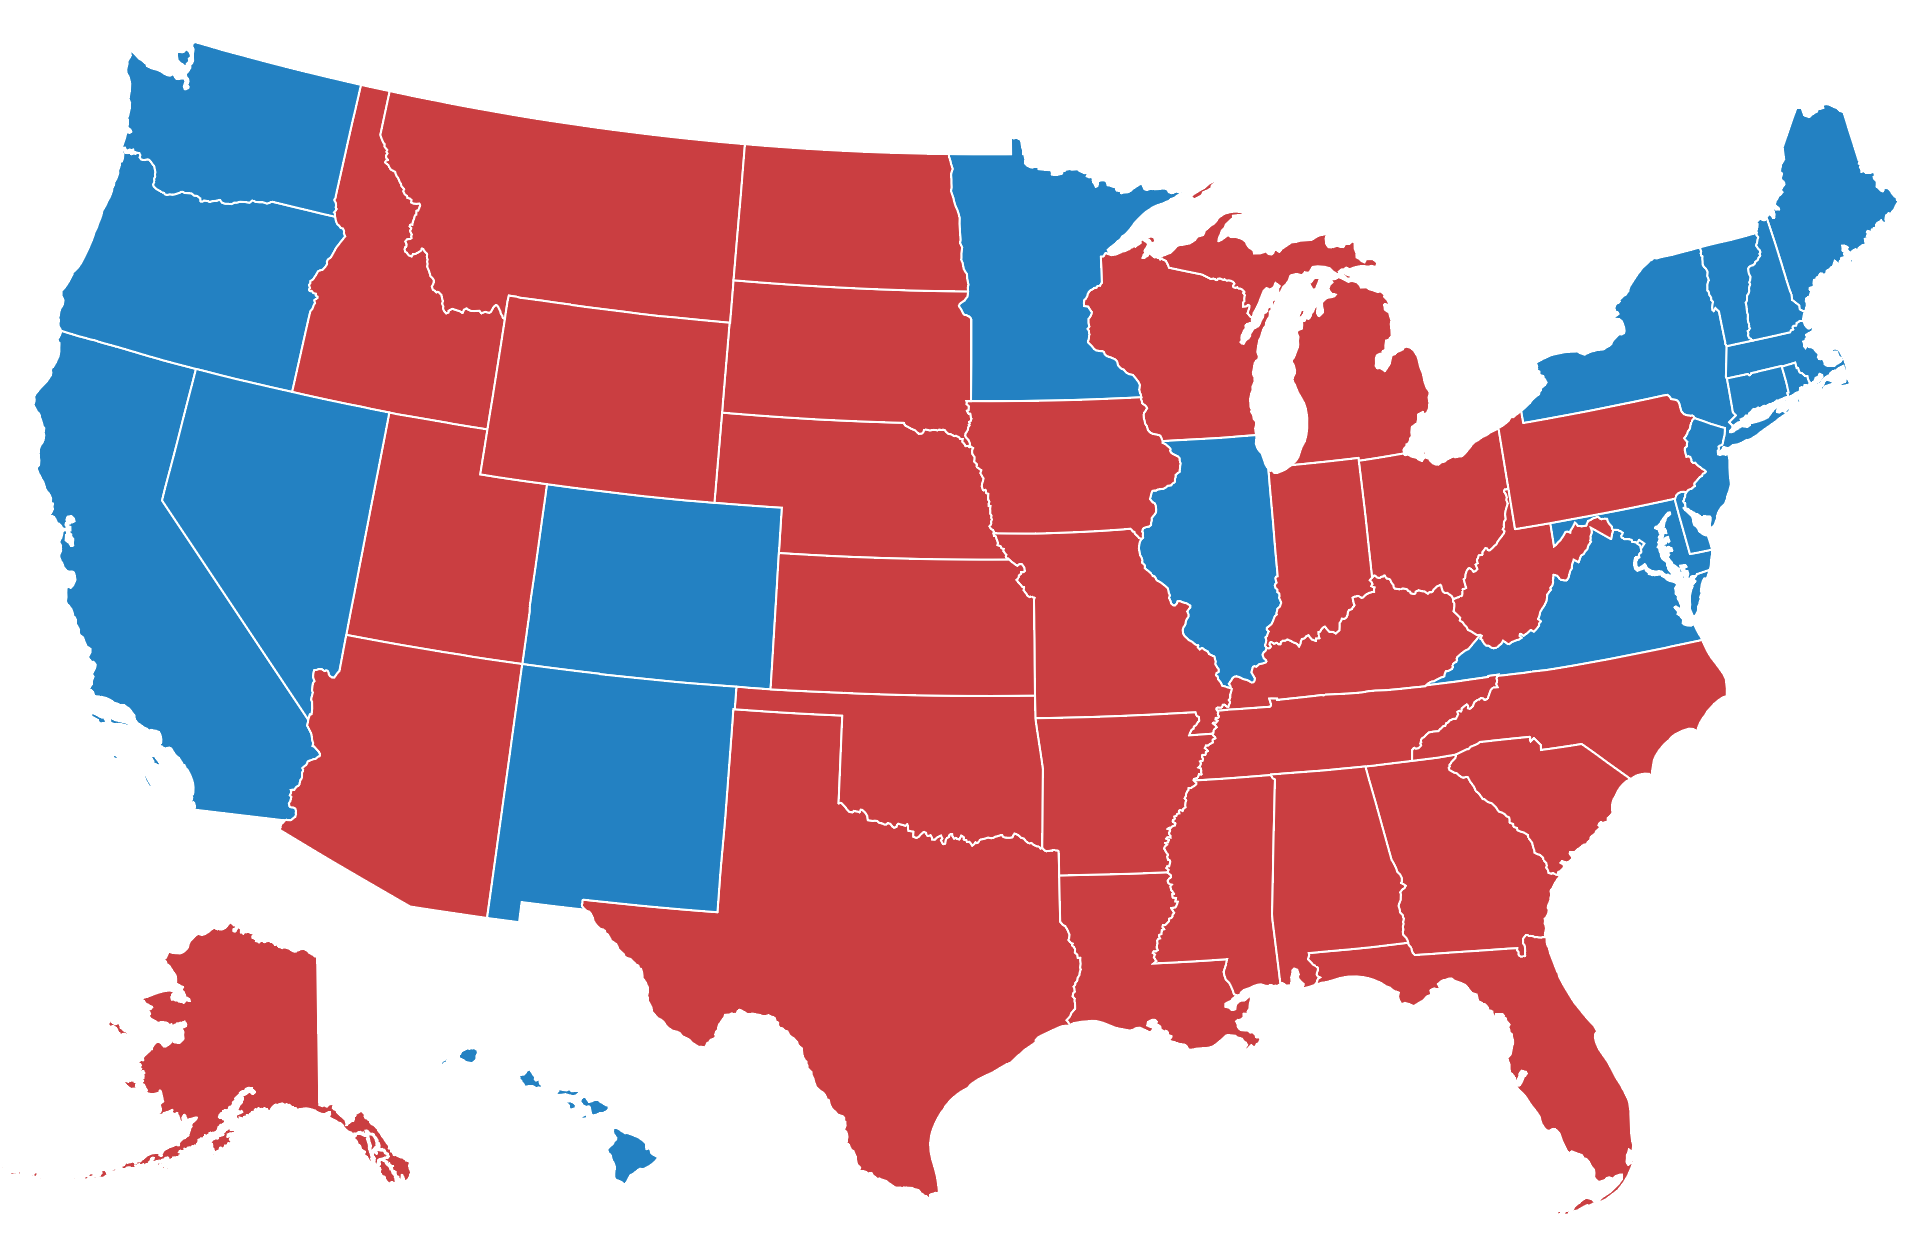
In this tutorial we’re going to create a map of U.S. states. Let’s download the us-states.svg file, which I created by throwing a US census shapefile into the mapshaper web interface. The important thing about this SVG file is that every state path has the two-letter state postal code set as id attribute. And thankfully, Illustrator is preserving these ids as layer names during SVG import. 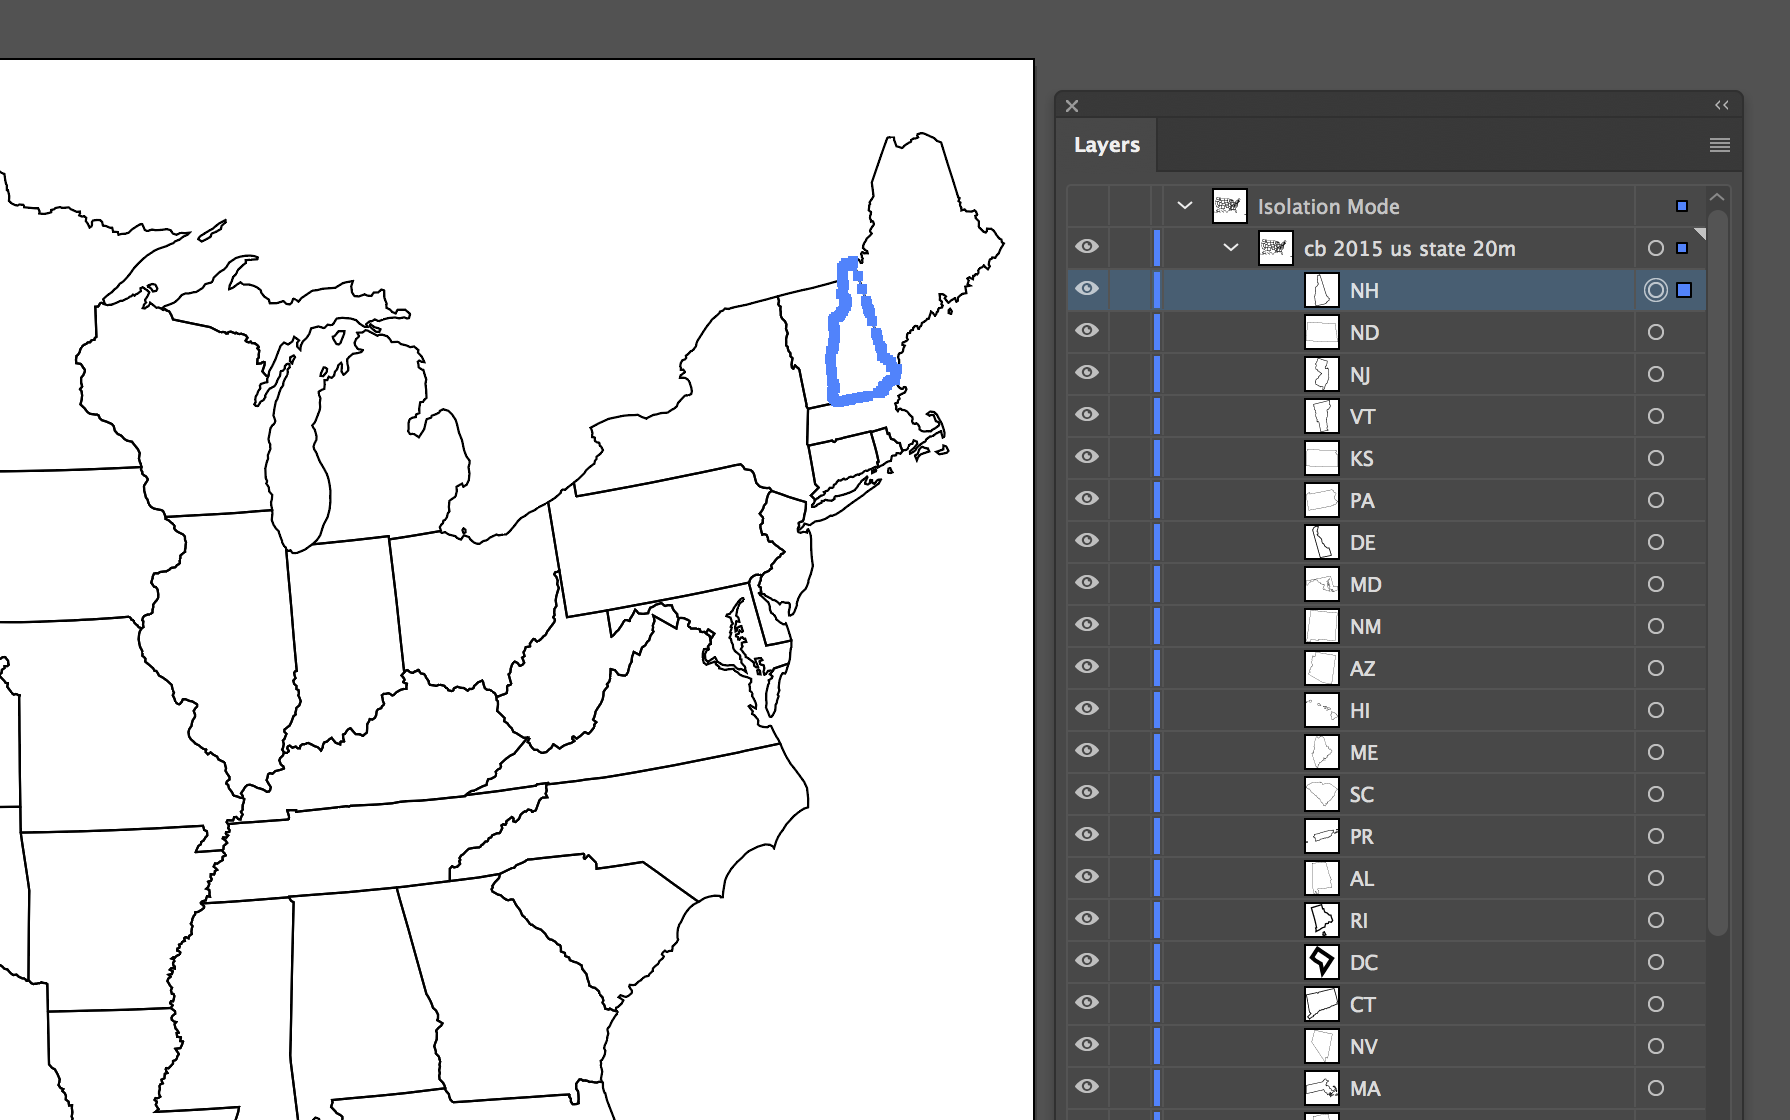
Step 3: Setting up the data file
Now we’re going to need to create the JSON file needed by the colorizer-script. You can use whatever script or data source you want to create this file, as long as the final output looks similar to this:
[
	{
		"file": "results",
		"data": {
			"AL": { "fill": "#cc3d3d", "stroke": false },
			"AK": { "fill": "#cc3d3d", "stroke": false },
			"AZ": { "fill": "#cc3d3d", "stroke": false },
			"AR": { "fill": "#cc3d3d", "stroke": false },
			"CA": { "fill": "#1a80c4", "stroke": false },
			"CO": { "fill": "#1a80c4", "stroke": false }
			//...
		}
	}
]
The keys under the “data” section need to match the path names in the Illustrator document, in our case the two-letter state codes. If you set stroke or fill to false, Illustrator will remove the stroke/fill. If you want either stroke or fill to be left unchanged, simply leave them out in the data file. If you’re playing along with the tutorial you can download the demo JSON file.
Step 4: Running the script
Finally you need to run the script. It will look for a data file called colorizer.json in the same folder where the Illustrator document is located. If it doesn’t find one, a file open dialog will pop up asking you for the location of the JSON data file. 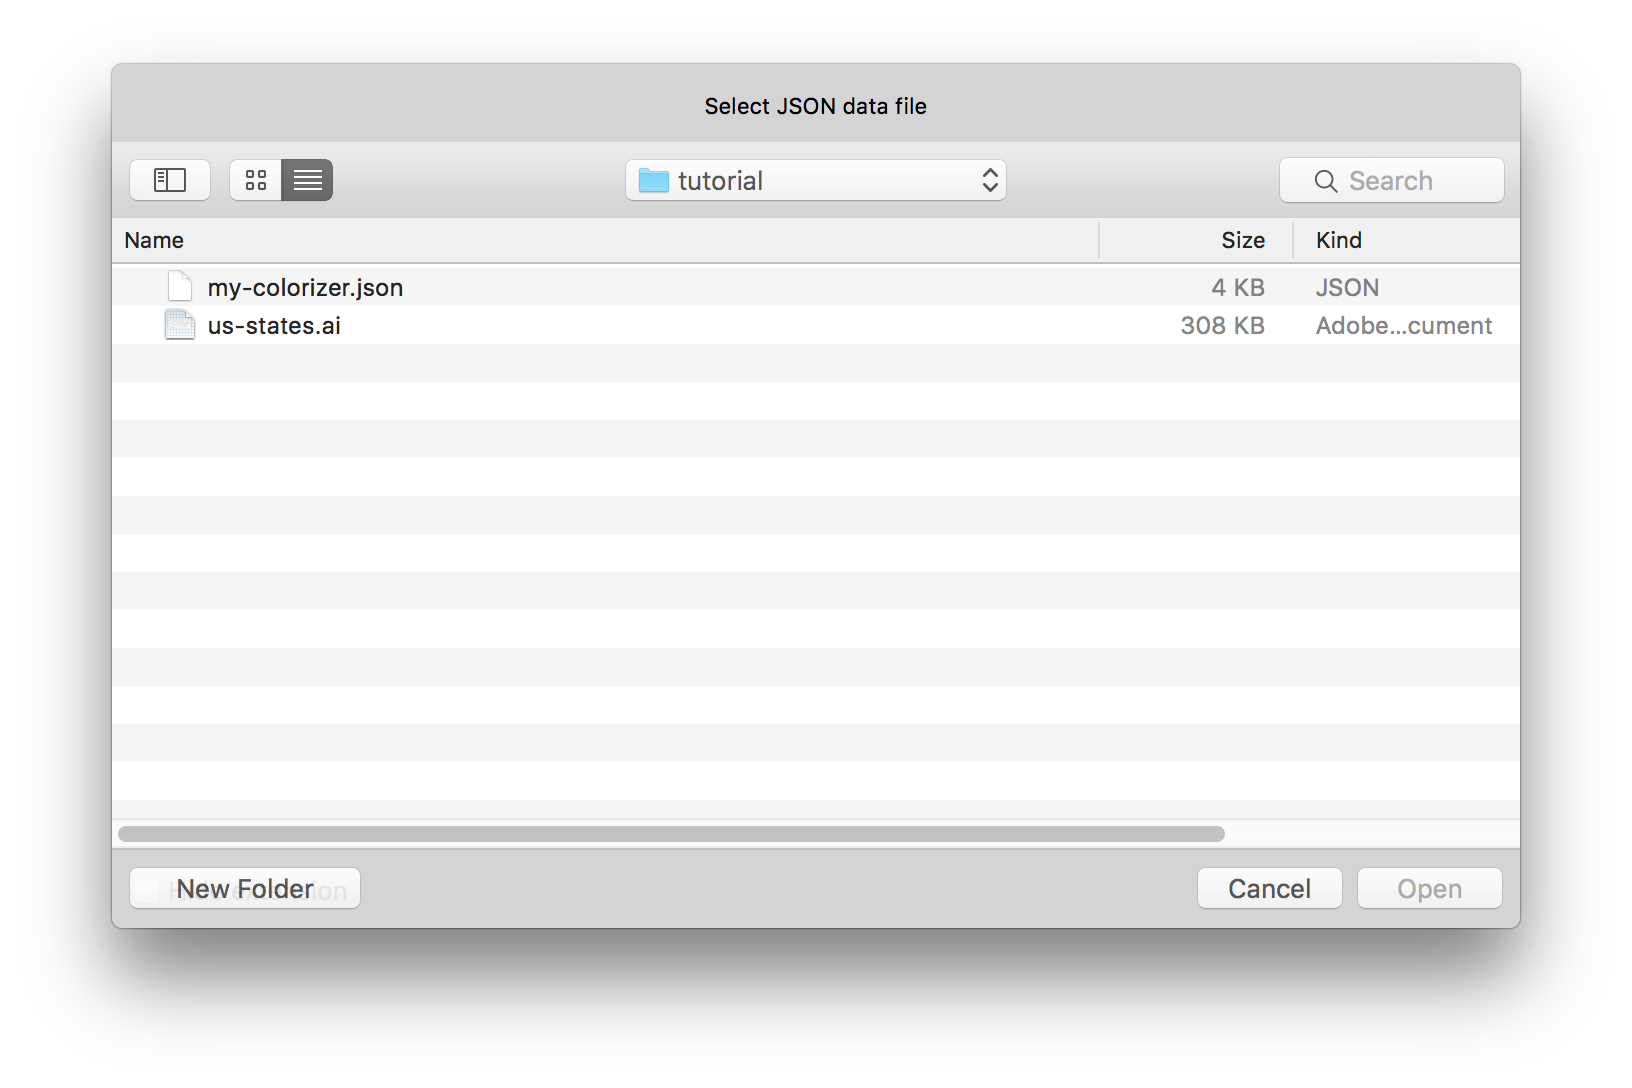 Just select the JSON file and click “Open”. Since the data file can contain multiple datasets, another dialog is popping up asking you to select a dataset from a list. This step also serves as final confirmation that you haven’t run the script accidentally.
 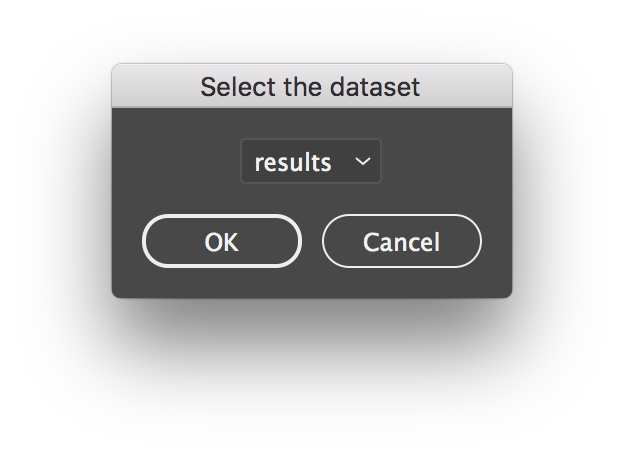 And boom: your map is now re-colored based on the colors from the data file.