Further Development Of The Piwik Map
Here are my ideas for the next version of Piwik Maps.
- The map has altogether four views: world, continent1 and two new country views for provinces and cities.
- In both country views there is one active country. All other countries are displayed in gray like the empty countries in world and continent view (the inactive country borders are missing in the following images, just imagine them for now).
- Since we now have three different zoom levels it is not as easy to provide simple navigation through the views. Starting from the world view, the user can click on active regions to zoom into it2. At every time, clicking at the “sea” (the white space) leads to a zoom out to the previous level. After selecting a country the user can switch between province and city view using the icons in the bottom icon bar.
- To improve the navigation between different countries, all inactive countries are labeled with their iso-code (or maybe the full country name). This way the user can easily jump between adjacent countries. Empty countries (= countries with no visitors coming from) are not clickable. The other country labels could be sized relativly to the number of visitors, but this may be to distractive.
- On top of the map the user can see the total number of visits for the active country.
Province view
Now we come to the first new country mode, which displays all sub-regions or provinces of a country. Since maintaining all provinces for nearly 300 countries means a lot of work, this feature may be limited to some countries at first. The tooltip displays the name (again a lot of work for the translators) and the selected metrics. I’m not quite sure about the percentage value, but I tend to relate it to the countries total value (and not the overall total value as in world view), which would mean “4% of the all site visitors of France came from Burgundy”. 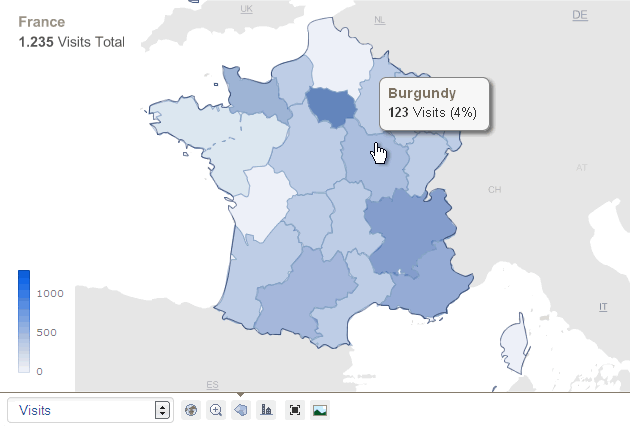
City view
The second country view displays all visitors city in the selected country. The concept should be familiar to most web analytics users, so I think it’s a good idea to adapt the bubble layout from GA. Note the change in the icon bar in the following mockup: 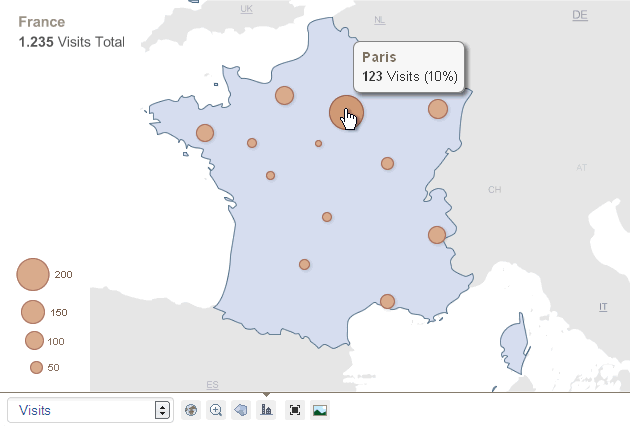 If you have any comments or suggestions for the further development of the map widget, feel free to join the discussion in the comment section.
Comments
PiwikBlog (Aug 17, 2010)
This is totally awesome and even better than what GA provides (at least the last time I looked at it). Which countries are on the current list for the detailed sub-region listing?
This obviously requires more detailed GEO data - will the plugin depend on the GEO-IP plugin or will it provide it’s own IP to Country/Region/City mapping?
The bubble layout for the City View looks good - can’t think of a better alternative. How will you retrieve the correct location of a city? Will it be hardcoded?
Regarding the percentage value: I agree that it’s best to show the percentage in relation to the total number of visits/views/.. of the country the region/city is in - otherwise the values will be too small to be interesting (0.0000123%..)
I’m not sure if showing the ISO-Code of a country is that helpful. As a european I know all country codes for european countries, but I’m fairly sure that I would’ve some problems with African/Asian countrie codes. If there’s enough space I suggest to show the complete country name..
Cheers Fabian
matt (Aug 17, 2010)
Great project, it all makes sense and sounds extremely promising :-)
I am not actually sure that we should translate regions names… how many words would this represent (assuming we do most countries eventually)?
If we really want to do translations, we can probably find them already done in some other softwares or scrape them from wikipedia or similar resources.
Labelling inactive countries with full country names would be better than labelling with ISO code.
Agreed that percentage should be relative to current country.
Maybe add, in the top label “France 1,200 visits (5%)” the percentage relative to the world, so that it is clear how important this country is.
Main requirement for this to happen is also to build GeoIp in Piwik core. Great work, looking forward to it!
Peter (Aug 17, 2010)
Hey Greg! Keep up the great work, the map project is really gettin’ hot!
Piwik 1.0 mit Weltkarte | bejonet (Sep 04, 2010)
[…] der Entwickler in seinem Blog angekündigt hat, wird diese Zoomfunktion im Laufe der nächsten Versionen noch ausgefeilter: Man wird die […]
Martin Schlagnitweit (Oct 15, 2010)
These Ideas looks awesome!
Is there a testable Version with the City and Province Views?
Paul (Nov 04, 2010)
That’ll be great!!
basos (Oct 25, 2010)
Looking forward to see it coming. Nice plugin anywayz…
Gregor (Oct 29, 2010)
Yes this is possible. I recently started with Open Flash Maps which adresses this issue. I’ll publish a tutorial in the next week..
Paul (Oct 29, 2010)
Hi! Your plugin is really great! I’d like to use it in my own application, would that be possible? I need to show a world map with some countries marked, so it’s exactly what you’ve done. Is it possible to download and use in own applications? Many thanks!
- Some continents are divided into serveral regions for better zooming performance↩
- This is the first difficult point since the world map already provides tooltips for individual countries. Some users might get annoyed when they have to find and click their preferred country twice. On the other hand are users which might get confused when jumping from the world view to a (possibly wrong selected) country.↩