Review of Observable Plot
Hi, I’m taking a year-long sabbatical from working on Datawrapper, so I’ll have some more time for blog posts! Also this means that I have time to try out tools I normally wouldn’t be using. And one thing I wanted to try out for quite some time now is Observable Plot.
![]()
Introduced in May 2021, Observable Plot (which I’ll call just Plot for the rest of this post) has been around for over two years. This review is about version 0.6.11, released today. As time passes, some things I noted in the review may have become obsolete.
Let’s start with what I love about Plot:
Amazing tool for prototyping visualizations
First of all, I agree with everything Toph wrote in his Plot for D3 Users introduction:
Although [Plot] is built on D3, you don’t write D3 to use it, and it’s naturally good at some very different things. It’s not “D3, but more so.” But for many people, It may be more in line with what they wanted from D3 in the first place. It gets a bar chart down to one line.
Plot is the best tool I know for rapid prototyping of visualizations in JavaScript! When you start working on a new project, you want to avoid deep-diving into several hundreds of lines of D3 code just to get a basic setup with axes, grids etc. That’s why, more often than not, I started my visualizations in R, using tidyverse and ggplot for quick experimentations of visual forms.
But with Plot, you can do the same in your browser. Just load your dataset (any array of simple objects will do) and fire up a Plot, then iterate by modifying the marks and options. The speed with which you’re able to do this is just breathtaking.
The reason this works is that Plot is analyzing the data and your marks and tries to make some educated choices for the scales, so you don’t have to define them manually (REPL).
Wide range of features
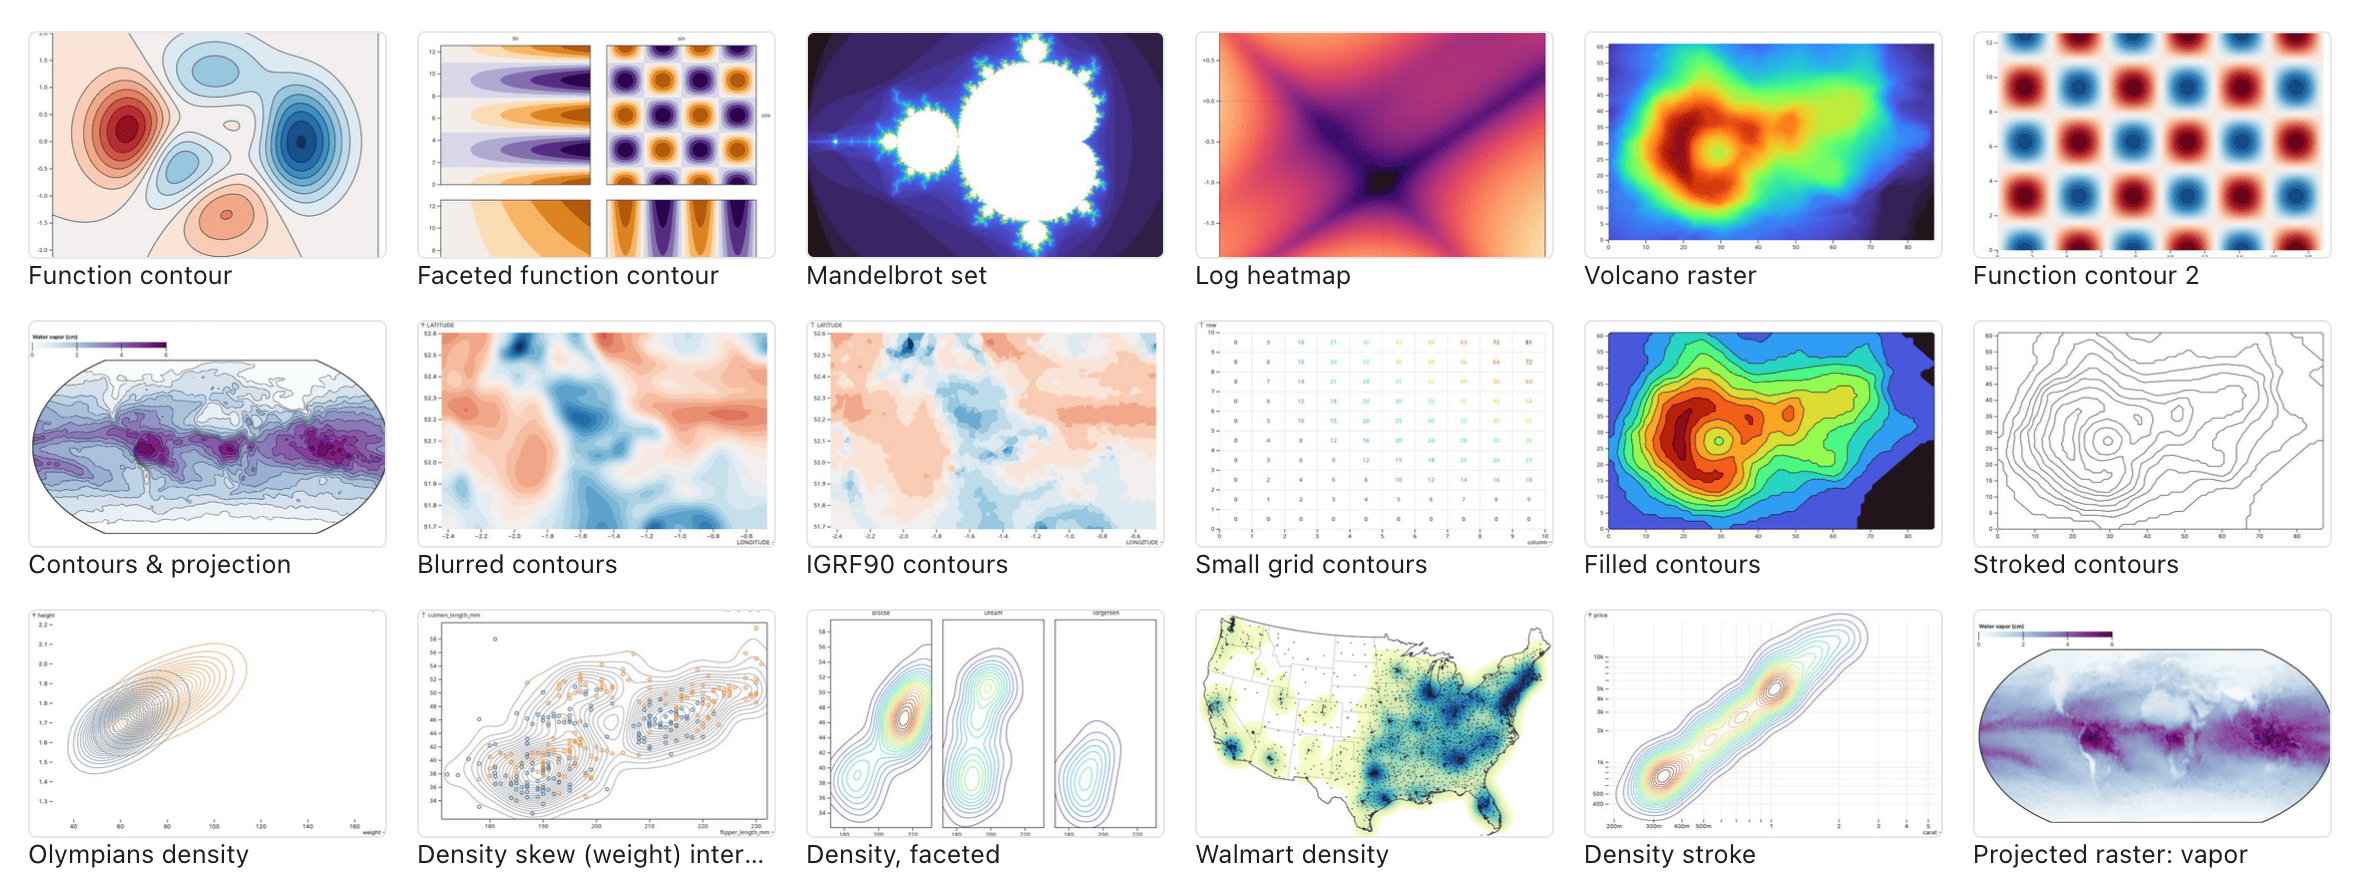
It’s just stunning to browse through the list of demos. Plot extends well beyond simple charting marks. I love how easy it is to create maps with it! Just take a look at the examples gallery to get blown away. It feels like there’s not much you can’t create using Plot!
Now, let’s come to the meat and dive into a few things I don’t like about Plot.
Plot is built for exploration, but not for the nicest rendering
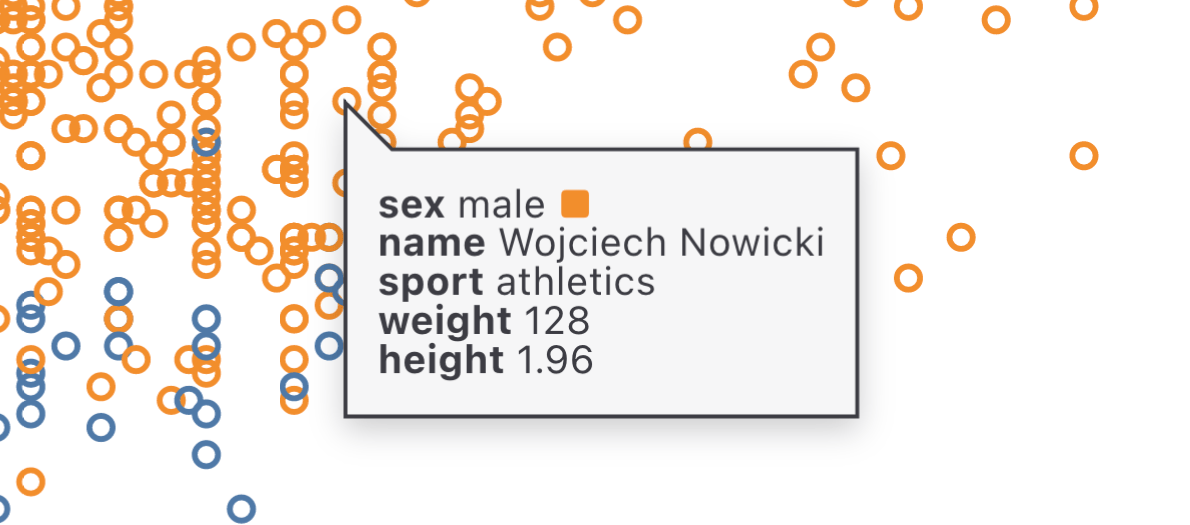
Plot does a lot to help you get started. You get axes, grids, and tooltips for free, everything you need to get going. But it does make certain things very hard when it comes to perfecting your visualization. The built-in tooltips look like they’re from a comic book, and there’s no way to customize them or to use HTML for their content.
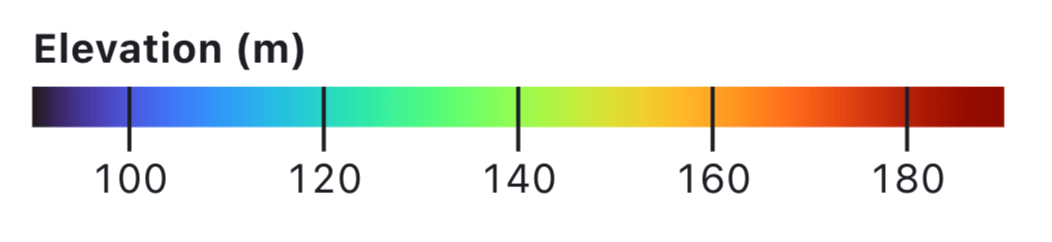
Similarly, there are few ways to customize the look or placement of the built-in legend. For instance, I didn’t find a way to enforce a “stepped” legend for a filled contour plot, which is only showing a discrete amount of colors on the page.
Plot is written in D3
Don’t get me wrong, D3 is awesome, and I have been writing a lot of D3 code for interactive visualizations over the past 10 years. While I was working at the New York Times, I was writing so much D3.js code that I started speeding things up using some helper methods which eventually ended up in d3-jetpack.
But we all know, that times have changed. Since I stopped working at the NYT almost six years ago, I also stopped writing certain kinds of D3 code. At Datawrapper, we’re building our new generation of visualization modules using a combination of Svelte (for reactivity & DOM manipulation) and D3 (for scales and the hard stuff). And I feel this is how pretty much everyone is building interactives these days.
But since Observable Plot has been born into a custom reactive environment, is written in non-reactive D3.js code. For instance, the code that adds a frame around a plot (really just a <rect>) looks like this. And as much as I would love to contribute Plot plugins — like a more flexible color legend, or tooltips with HTML content — I am also done using D3 for manual DOM manipulation using the old-fashioned
select(…).datum(…).append(…).attr(…).on(…)chains.
Very minimalistic API
The API of Plot is very minimalistic: you invoke the Plot method with some options and it returns an SVG element with your plot. That’s nice if all you want to do is to render the plot, but if you want to do more, you’re on your own.
const plot = Plot(options);
document.body.appendChild(plot);
As of version 0.6.11, Plot is giving you two ways to work with a visualization after it has been rendered. Using plot.scale() you can get a reference to the scale, which is crucial since Plot is inferring scales from your data and the marks you defined, but you may need the scales outside of the plot, too.
const plot = Plot({ marks: [Plot.dotX([1, 2, 3, 4])] });
document.body.appendChild(plot);
plot.scale('x').apply(2); // returns the x position for value 2
The second API Plot objects provide is plot.legend() which allows you to render a legend outside of your Plot, e.g. to position it absolutely rather than stacking it above your visualization, which is currently the only supported layout.
But there’s a lot more I would want to do after a plot has rendered. Say, I want to change the style of some text to highlight an element selected outside of the plot. Of course, I can just write normal D3 code to do this, but it would be easier if Plot would provide an API for adjusting mark options post-rendering.
I also think it would be cleaner if Plot would just return a JavaScript object, including a reference to the root SVG element, instead of attaching custom methods to a DOM element.
Limited options for interactivity
Here’s what Toph wrote about Plot and reactivity (and interactivity):
Plot doesn’t re-implement reactivity internally because it grew up in a context in which reactivity is in the air all around.
That’s true, in the context of an Observable notebook you don’t really need a lot of interactivity. But for real world interactives or dashboards, the situation is different. And as of now, there isn’t even a way to add event handlers directly to marks you create.
You can add tooltips and crosshairs for interactivity (also a new brushing interaction is in active development), and you can also catch click events on the root Plot element itself, but you’re on your own if you need to know which mark was actually emitting an event.
For instance, a Plot like this (REPL)
const plot = Plot.dotX([1, 2, 3, 4], { r: 10 }).plot();
plot.addEventListener('click', (event) => {
	console.log('you clicked on ' + event.target);
});
will emit a PointerEvent event which includes the event target (the <circle> element) and the internal __data__ property, which is the index of the element in the provided data array. But all that feels very hacky and it falls apart as soon as you have a plot with multiple marks originating from different arrays (REPL):
const plot = Plot({
	marks: [
		Plot.dotX([1, 2, 5, 3], { r: 10, fill: 'currentColor' }),
		Plot.dotX([4, 6], { r: 10, fill: 'red' })
	]
});
plot.addEventListener('click', (event) => {
	console.log('you clicked on ' + event.target.__data__);
});
There’s also an (undocumented) global plot.value that gives you the last data object that was involved in an interaction, but for this you need to include an interactive mark such as Tip, Pointer, or Crosshair for this to work.
Inconsistencies
It’s unclear to me why some mark properties can be evaluated using functions while others can’t. Why can I set the text font size via function, but not the font weight? In a chart I wanted to have the axis tick for the currently selected month to be bold, but there’s no way to do that except to define two separate text mark layers.
Plot({
	marks: [
		Plot.text([1, 2, 3, 5], {
			x: (d) => d,
			fontSize: (d) => 14 + d * 5,
			// WORKS:
			fontWeight: 'bold'
			// DOESN'T WORK:
			// fontWeight: d => d < 4 ? 'normal' : 'bold'
		})
	]
});Entanglements between D3 and Plot
My last point is more about a structural issue on the development of D3 vs Plot. It feels as if some things that should have been built into D3 are now getting added to Plot, so the introduction of Plot created a bit of a mess.
I’ll give you two examples.
When working with temporal intervals for scales you will come across the d3-time package. It always bugged me that I can’t just create a time interval using something like d3.interval('month') but that I have to
import { timeMonth } from 'd3-time';So whenever I want to use intervals in a programmatic way, I need some glue code that translates from "month" to timeMonth() (it’s similar with geo projections).
Now the good news is that Plot changed that. Here I can just set intervals using
Plot({ x: { interval: 'month' } });That’s amazing, right? Except this new convenient mapping is part of Plot. Why can’t this API become part of d3-time?
Another example for this entanglement is the contour mark, which is basically built using d3-contour. But I noticed that the Plot contour mark has a super nice feature missing from d3-contour: that it automatically converts arbitrary points into a regular mesh.
And I checked the source code and indeed, this magic happens in Plot. Again, why isn’t this a D3 feature?
Summary
Plot is an amazing tool for prototyping interactives or exploring a new dataset. It’s perfectly suited for data analysis notebooks, like it’s main environment Observable.
If your goal is to produce production-ready interactive visualizations, however, you will probably hit some dead-ends with Plot and may end up re-creating the plots from scratch, since Plot doesn’t give you a lot of ways for customizing or adding interactivity.
Please let me note again, that this review is based on the current version of Plot (as of Sept. 21, 2023), and will likely be outdated very soon, given the speedy progress the team is making.
Obviously, also a BIG shoutout to the folks at Observable for making Plot open-source and free to use for anyone, even outside of Observable^[Btw, I created a little wrapper component that makes it a bit easier to use Plot in Svelte]. I don’t want to miss it from the JS toolchain ever again.