Why you should consider adding DuckDB (and SQL!) to your data analysis toolbelt
Last week, I gave a workshop on using DuckDB for high-performing data analysis at SciCar (a conference where scientists meet data journalists). This blog post is a write-up of my presentation, which included an interactive DuckDB demo / tutorial.
Before we start, let’s address the elephant in the room:
SQL? Really?
I know, I know. SQL? Really? Are we in the 1980s again? Don’t we have R and Python and frameworks like tidyverse or pandas to do everything with data? Yes, we do. But please, hear me out. Or rather, let me ask you three questions:
Did you ever wish you could just run your data analysis directly in the browser where you can hook them into interactive visualizations?
Assuming you’re used to doing your data analysis with either Python or R, did you ever run into people from the “other team”, and had to explain your code?
Did you ever struggle to run your sophisticated R/Python scripts on a minimal production system and you ended up rewriting them in some other language?
If you said yes to at least one of the questions, I may have a chance to pique your interest in DuckDB and SQL!
What is SQL?
If you never used SQL before, let me give you a quick refresher (feel free to skip, obviously).
SQL stands for Structured Query Language and has been around since the 1970s when it was invented at IBM. It was so popular that in 1986, it became an ANSI standard, and a year later, ISO as well.
Here’s an example of a simple SQL query:
SELECT name FROM employees WHERE birthday = TODAY();As you see, SQL reads almost like the English sentence “Select name from employees where birthday equals today.” And that’s the basic idea of SQL!
If you’ve never seen a SQL query before reading this blog post, try guessing what the following query is doing:
UPDATE employee SET salary = salary * 1.5 WHERE job = 'Data journalist';Pretty sure you could figure it out 😉. Now let’s see how the same query looks in proper R/dplyr code:
employees %>%
  mutate(salary =
    ifelse(job == 'Data journalist', salary * 1.5, salary)
  )
And this is how it looks in Python/pandas:
employees.loc[employees['job'] == 'Data journalist', 'salary'] *= 1.5And, of course, you can also do the same in pure JavaScript (but keep in mind that it’s much slower):
employees
  .filter(d => d.job === 'Data journalist')
  .forEach(d => d.salary =* 1.5);
Now, isn’t that ugly in comparison?
So why aren’t we all using SQL already?
Okay, SQL looks nice in theory, so why aren’t we all using it already?
SQL requires a DB engine that interprets and runs the queries, like MySQL or PostgreSQL. And most DB engines have been bad in terms of user-friendliness. If you manage to install your database, you need to figure out how to connect to it, and even if you do, it’s unclear where your data is stored, how you import and export data to and from your database, etc.
SQLite is a database engine that tried to keep things simple by storing databases in single files, but it never took off for data analysis because it wasn’t designed for it.
Say hello to the Duck!
That’s where DuckDB comes in. Think of it as SQLite, but made for high-performance and convenient data analysis tasks. It’s using SQL, but it’s SQL on steroids.
You’re probably wondering what’s up with the name, so let’s get this out of the way, too. This is the official explanation from the DuckDB FAQ:
Ducks are amazing animals. They can fly, walk and swim. They can also live off pretty much everything. They are quite resilient to environmental challenges. A duck’s song will bring people back from the dead and inspires database research. They are thus the perfect mascot for a versatile and resilient data management system. Also the logo designs itself.
At this point of the workshop, I switched to an interactive demo, using which we walked through several SQL queries to explain the benefits of DuckDB. If you have a bit of time, feel free to dive in as well:
How does it work?
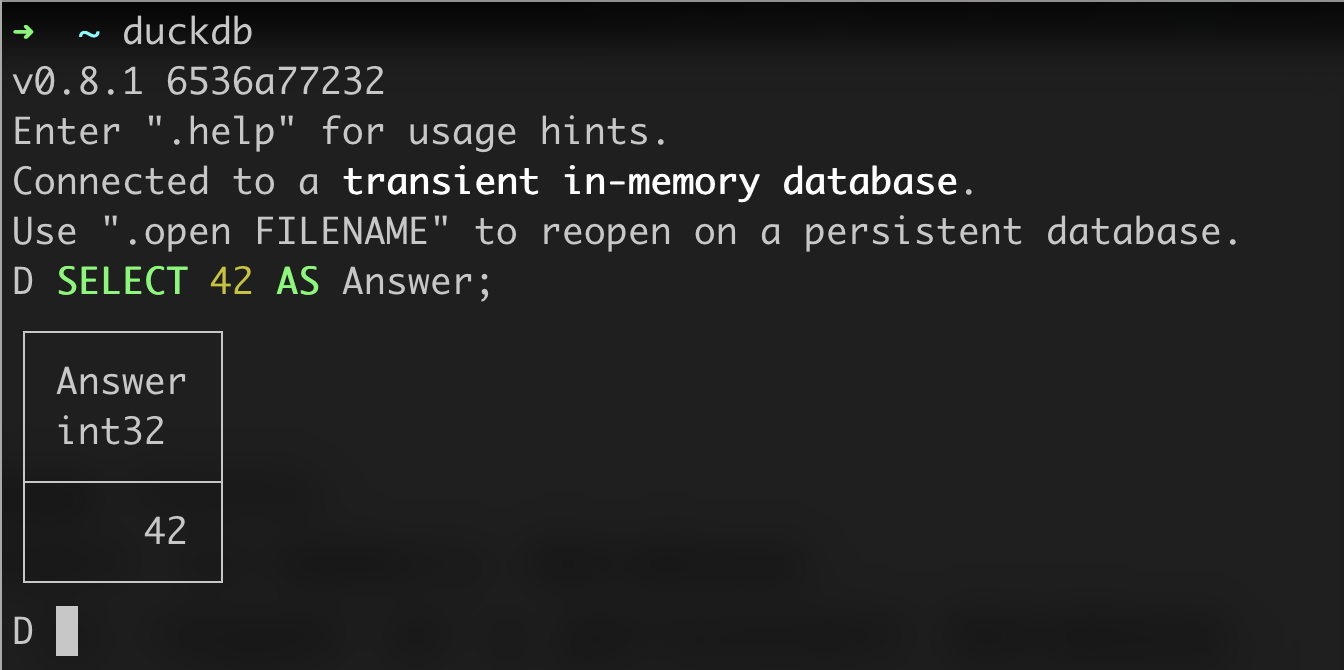
One of the fastest ways to use DuckDB is to install it and open an interactive command-line session:
But since DuckDB is a database, there are bindings for many programming languages that allow you to use it anywhere you want: Node, Python, R, C / C++, Java, Rust, Scala, Swift, WASM, ODBC
For instance, this is how you can run queries in Node:
import duckdb from 'duckdb';
const db = new duckdb.Database(':memory:');
// or a file name for a persistent DB
db.all('SELECT 42 AS fortytwo', (err, res) => {
	if (err) throw err;
	console.log(res[0].fortytwo);
});
Or in Python:
import duckdb
db = duckdb.connect('file.db')
db.sql('SELECT 42').show()
Or in R:
library('DBI');
con <- dbConnect(duckdb::duckdb(), (dbdir = ':memory:'));
res <- dbGetQuery(con, 'SELECT 42');
print(res);
And since DuckDB also runs in the browser, you can use it in web apps like Observable, too:
stocks = DuckDBClient.of({
	aapl: FileAttachment('aapl.csv'),
	amzn: FileAttachment('amzn.csv'),
	goog: FileAttachment('goog.csv'),
	ibm: FileAttachment('ibm.csv')
});
Advantages of DuckDB
Amazingly, DuckDB comes under an MIT license, so it’s free and open-source! It installs across platforms (Windows, Mac, Linux) and CPU architectures. And since it’s a database, you can use it in virtually any programming language you want.
That means you can work in different environments, for instance, beginning your analysis in an Observable notebook and then using the same queries on a production Node server (in contrast to R, it installs easily on tiny EC2 instances with limited RAM).
DuckDB makes it easy to import and export various data formats. One of my favorite features is that it lets you read an entire folder of data files in one go:
CREATE TABLE rides AS SELECT
	hvfhs_license_num,
	PULocationID,
	DOLocationID,
	base_passenger_fare,
	trip_miles
FROM './fhvhv_*.parquet';
Since DuckDB uses SQL and comes with ODBC drivers, you can use it in whatever DB tools you are familiar with already, such as DBeaver, or SequelPro.
DuckDB has many amazing features, and we’ve touched on a few in the interactive demo. But I want to point out Correlated Subqueries in SQL, which are super powerful and fast. On top of that, DuckDB comes with a set of mighty extensions, including for reading data directly from remote sources (using HTTPFS or AWS) and for working with geospatial data.
Downsides of DuckDB
Unfortunately, the browser version is a bit too large (~20M) to use in smaller visualization projects, but I think it’s ok for use in bigger apps like dashboards. In fact, you may want to check out Mosaic, which is a hot new framework for linking databases and interactive (Observable Plot-based) views.
Also, you never want to use DuckDB when you have multiple writing clients, say as a backend for a traditional web app. Multiple clients can read from the same database but not write to it.
Another thing worth mentioning is that once you start using DuckDB’s SQL dialect, you’ll start relying on features that are not yet supported by other DB engines, so there’s a bit of risk of getting locked in.
Finally, remember that DuckDB is still in “preview release” mode, so until the release of version 1, some things will likely change and may break your code. It’s worth following the DuckDB blog to stay up-to-date on recent developments and newly introduced features.
I hope you liked this introduction to DuckDB and will consider using it in the future!